Project Schedules The Management Model On Agile Methodology

Agile Development: Project Schedules on an Agile Methodology

If you come from a traditional project management background, or if you have a Project Management Office (PMO) that needs a project monitoring tool or status, then you’ll be used to Gantt charts; but in Agile we’ve got even better tools for the management and visualisation of progress.
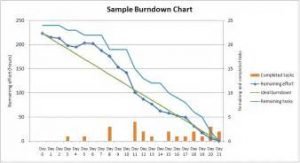
Tracking the burndown graph that shows the evolution of the sprint is vital to the progress of the development cycle, as are Kanban boards that make it easier to see the task progression.
By using these two tools, we actually have significantly more control than with a complex Gantt chart. The tasks are the stories, which for the users have a clear outcome, as they can actually see the deliverable emerging.
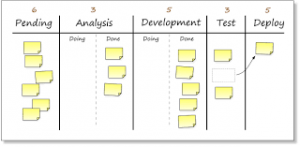
The Kanban Board is used to show progress of individual stories and their progression through the development cycle. There is no need to micro-manage the sub-tasks – just keep an eye on the story.
Kanban Board

Burndown Chart

The burndown shows the throughput of work, and how much there is to go. The work left to be done could be seen as both effort and complexity – because they are the same thing.
Here are some tips that can help you create these progress charts for Agile software development projects:
Don’t overcomplicate the Kanban board; just make sure it works and is being used.
The most granular level in the Agile timeline is that of the stories, so it is not necessary to include sub-tasks for the stories.
It does not make sense to control the timing of each story, since we are talking about the timing of each iteration (sprint), and the set of stories that compose these iterations.


